The interactive data visualization was initially based on the report Trends from 2006-2018 in Health Behaviour, Health Outcomes and Social Context of Adolescents in Luxembourg.
The current version of the interactive data visualization also includes the data from the 2022 survey. It shows the evolution of key indicators of the health and well-being of adolescents in Luxembourg between 2006 and 2022.
In addition, four factsheets exploring the data from the 2022 survey have been published:
– Health Complaints of school-aged children (Factsheet Nr. 1) ![]()
![]()
![]()
– Physical Activity, Dietary Consumption and Weight Status of school-aged children (Factsheet Nr. 2) ![]()
![]()
![]()
– Substance Consumption of school-aged children (Factsheet Nr. 3) ![]()
![]()
![]()
– Liking School and Schoolwork Pressure perceptions of school-aged children (Factsheet Nr. 4) ![]()
![]()
![]()
In order to be accessible to a larger number of people, the data visualization uses a palette that is colour-blind friendly.
QUESTION
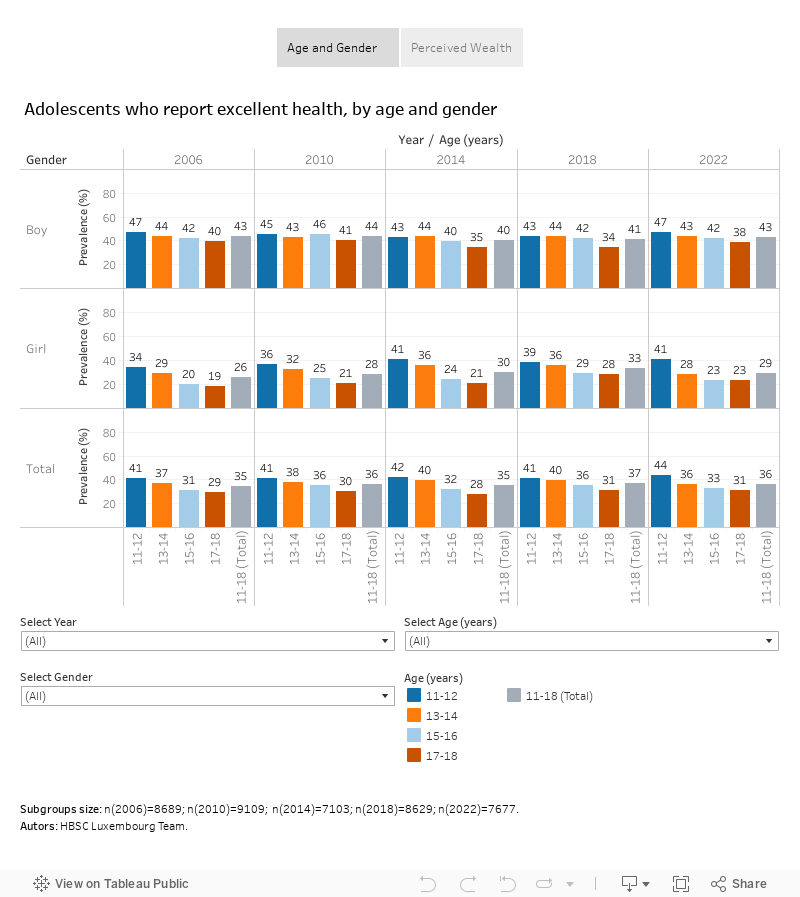
Adolescents were asked to rate their health on a four-point scale. Answers categories ranged from 1 “excellent” to 4 “poor”. The finds below present the proportion of adolescents who rate their health as “excellent”.
FINDINGS
The findings below represents pupils from Luxembourg only. If you want to see Luxembourg in an international comparison: HBSC study data browser and International Report from the 2021/2022 survey.
How to navigate the data?
Check and/or uncheck the items from the list to filter or highlight;
Place the cursor on the chart to view the pop-up with more information;
Click the chart to highlight data.
In the bottom of the data vizualization ![]() click the bar icons to:
click the bar icons to:
![]() Reset (return to the original visualization);
Reset (return to the original visualization);
![]() Share the visual;
Share the visual;
![]() Download;
Download;
![]() View in full screen.
View in full screen.
QUESTION
Adolescents were asked how many times during the past 12 months they were injured and had to be treated by a doctor or nurse. This question was asked on a five-point scale. Answer categories ranged from 1 “I was not injured in the past 12 months” (category 1) to “4 times or more” (category 5). The findings in this visual present the proportion of adolescents who were injured at least once (i.e. categories 2 to 5).
FINDINGS
The findings below represents pupils from Luxembourg only. If you want to see Luxembourg in an international comparison: European Health Information Gateway.

How to navigate the data?
Check and/or uncheck the items from the list to filter or highlight;
Place the cursor on the chart to view the pop-up with more information;
Click the chart to highlight data.
In the bottom of the data vizualization ![]() click the bar icons to:
click the bar icons to:
![]() Reset (return to the original visualization);
Reset (return to the original visualization);
![]() Share the visual;
Share the visual;
![]() Download;
Download;
![]() View in full screen.
View in full screen.
QUESTION
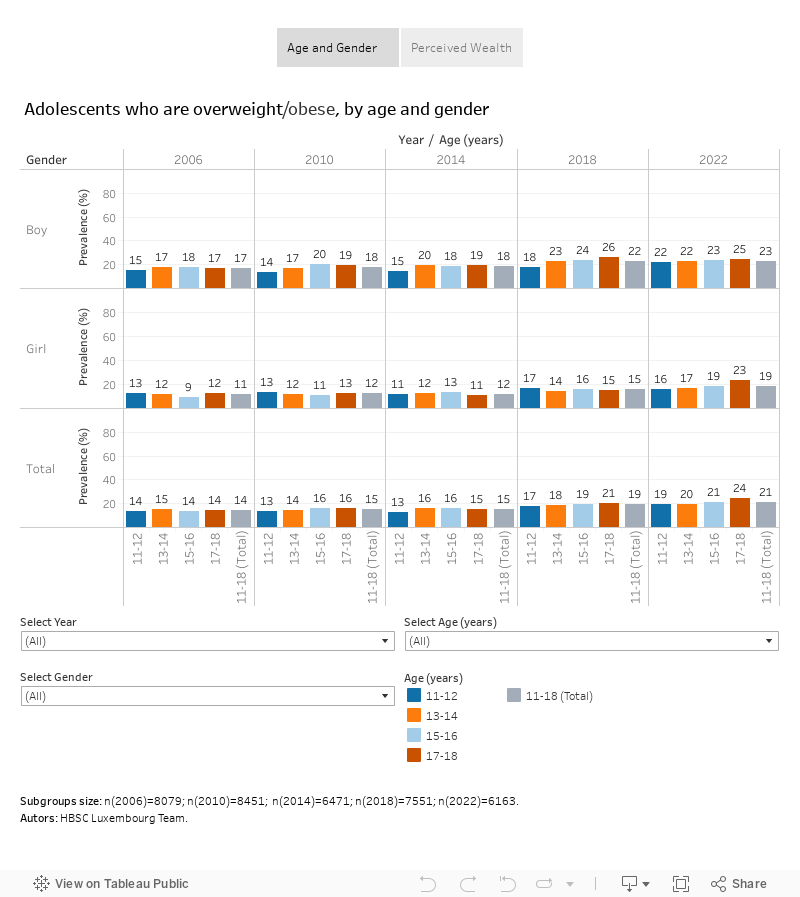
Adolescents were asked about their height and weight. Based on this information, their BMI (body mass index) was calculated. The findings in this visual present the proportion of adolescents who are overweight/obese according to their BMI score and the cut-of values as defined by the International Obesity Task Force.
FINDINGS
The findings below represents pupils from Luxembourg only. If you want to see Luxembourg in an international comparison: HBSC study data browser and International Report from the 2021/2022 survey.
How to navigate the data?
Check and/or uncheck the items from the list to filter or highlight;
Place the cursor on the chart to view the pop-up with more information;
Click the chart to highlight data.
In the bottom of the data vizualization ![]() click the bar icons to:
click the bar icons to:
![]() Reset (return to the original visualization);
Reset (return to the original visualization);
![]() Share the visual;
Share the visual;
![]() Download;
Download;
![]() View in full screen.
View in full screen.
QUESTION
Adolescents were asked about their height and weight. Based on this information, their BMI (body mass index) was calculated. The findings in this visual present the proportion of adolescents who are underweight according to their BMI score and the cut-of values as defined by the International Obesity Task Force.
FINDINGS
The findings below represents pupils from Luxembourg only. If you want to see Luxembourg in an international comparison: HBSC study data browser and International Report from the 2021/2022 survey.

How to navigate the data?
Check and/or uncheck the items from the list to filter or highlight;
Place the cursor on the chart to view the pop-up with more information;
Click the chart to highlight data.
In the bottom of the data vizualization ![]() click the bar icons to:
click the bar icons to:
![]() Reset (return to the original visualization);
Reset (return to the original visualization);
![]() Share the visual;
Share the visual;
![]() Download;
Download;
![]() View in full screen.
View in full screen.
QUESTION
To find out how the adolescents perceive their bodies, they were asked to complete the following sentence: “Do you think your body is …”. Answers ranged from “far too thin” (category 1) to “far too fat” (category 5) on a 5-point scale, with “about the right size” marking the middle. The findings in this visual present the proportion of adolescents who think that they are too thin (i.e. categories 1 and 2).
FINDINGS
The findings below represents pupils from Luxembourg only.

How to navigate the data?
Check and/or uncheck the items from the list to filter or highlight;
Place the cursor on the chart to view the pop-up with more information;
Click the chart to highlight data.
In the bottom of the data vizualization ![]() click the bar icons to:
click the bar icons to:
![]() Reset (return to the original visualization);
Reset (return to the original visualization);
![]() Share the visual;
Share the visual;
![]() Download;
Download;
![]() View in full screen.
View in full screen.
QUESTION
To find out how the adolescents perceive their bodies, they were asked to complete the following sentence: “Do you think your body is …”. Answers ranged from “far too thin” (category 1) to “far too fat” (category 5) on a 5-point scale, with “about the right size” marking the middle. The findings in this visual present the proportion of adolescents who think that they are too fat (i.e. categories 4 and 5).
FINDINGS
The findings below represents pupils from Luxembourg only. If you want to see Luxembourg in an international comparison: HBSC study data browser et International Report from the 2021/2022 survey.

How to navigate the data?
Check and/or uncheck the items from the list to filter or highlight;
Place the cursor on the chart to view the pop-up with more information;
Click the chart to highlight data.
In the bottom of the data vizualization ![]() click the bar icons to:
click the bar icons to:
![]() Reset (return to the original visualization);
Reset (return to the original visualization);
![]() Share the visual;
Share the visual;
![]() Download;
Download;
![]() View in full screen.
View in full screen.
QUESTION
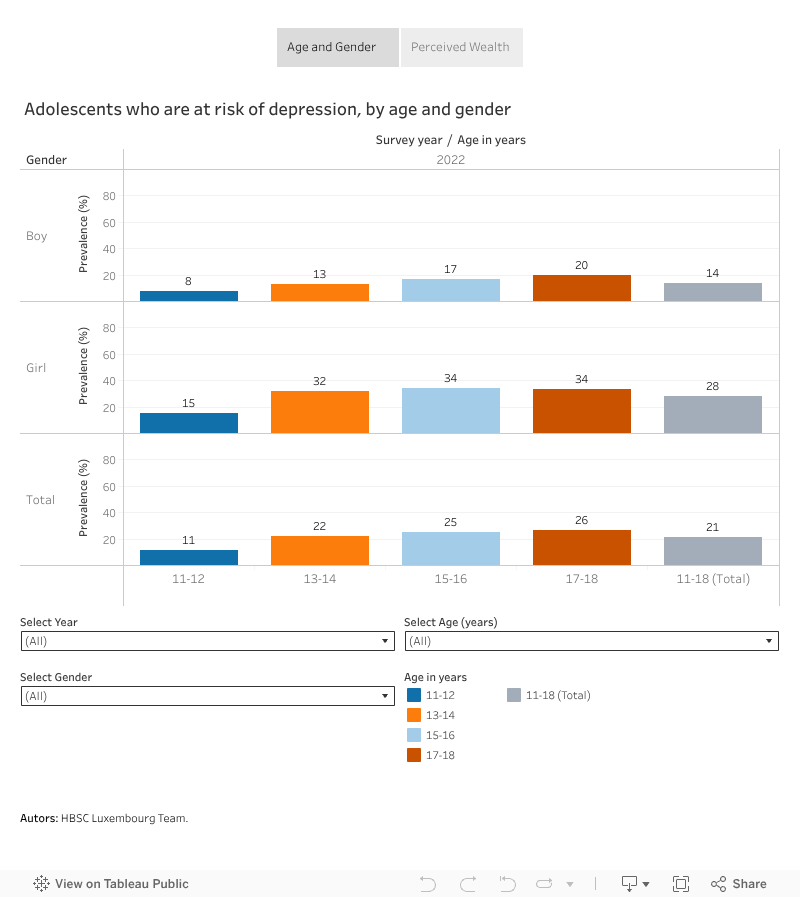
Adolescents completed the WHO-5 Well-Being Index questionnaire, which assesses positive mood, vitality, and general interests with 5 statements. Responses are on a 6-point rating scale ranging from “at no time” (scored as 0) to “all the time” (scored as 5), with a sum score from 0-to-25. They were categorised into two groups: at risk of depression (0-to-9) and not at risk of depression (10-to-25). The findings in this visual present the percentage of adolescents who were at risk of depression.
More information can be found in Mental health and well-being of school-aged children in Luxembourg – Report on the Luxembourg HBSC Survey 2022.
FINDINGS
The findings below represent pupils from Luxembourg only.
How to navigate the data?
Check and/or uncheck the items from the list to filter or highlight;
Place the cursor on the chart to view the pop-up with more information;
Click the chart to highlight data.
In the bottom of the data vizualization ![]() click the bar icons to:
click the bar icons to:
![]() Reset (return to the original visualization);
Reset (return to the original visualization);
![]() Share the visual;
Share the visual;
![]() Download;
Download;
![]() View in full screen.
View in full screen.
QUESTION
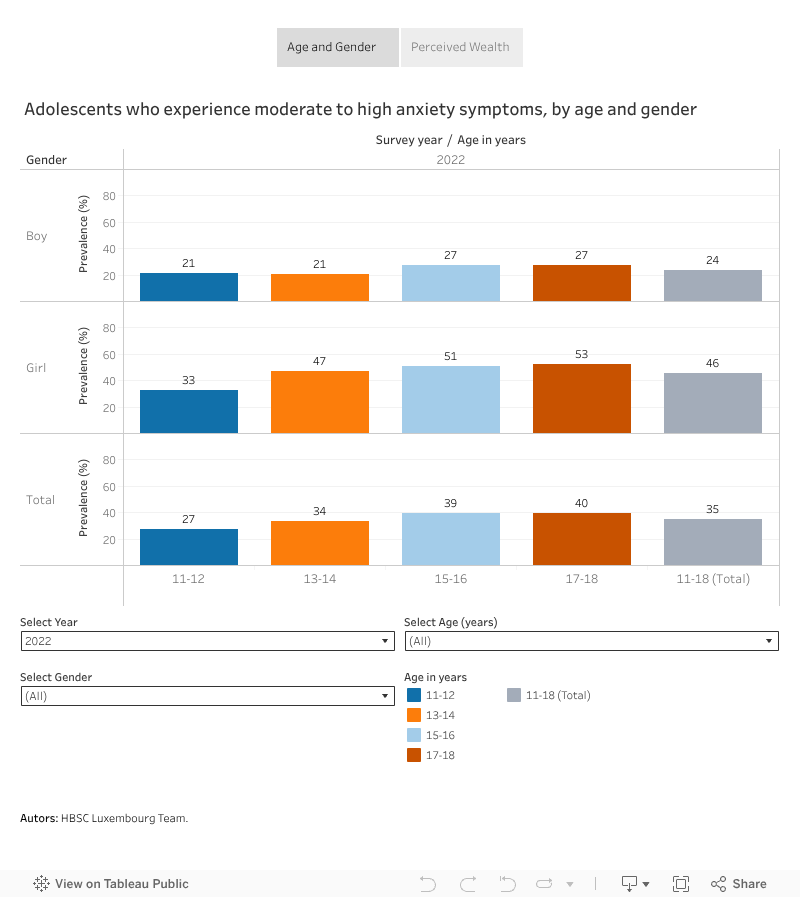
Adolescents were asked how often they had felt nervous, anxious or on edge, as well as their inability to stop or control worries in the past two weeks. The answer options ranged from “not at all” (0) to “almost every day” (3), with a sum score from 0 to 6. Anxiety symptomatology was categorised as: no anxiety symptoms (categories 0-to-2) and moderate to high anxiety symptoms (categories 3-to-6). The findings in this visual present the proportion of adolescents who experienced moderate to high anxiety symptoms.
More information can be found in Mental health and well-being of school-aged children in Luxembourg – Report on the Luxembourg HBSC Survey 2022.
FINDINGS
The findings below represent pupils from Luxembourg only. If you want to see Luxembourg in an international comparison: HBSC study data browser and International Report from the 2021/2022 survey.
How to navigate the data?
Check and/or uncheck the items from the list to filter or highlight;
Place the cursor on the chart to view the pop-up with more information;
Click the chart to highlight data.
In the bottom of the data vizualization ![]() click the bar icons to:
click the bar icons to:
![]() Reset (return to the original visualization);
Reset (return to the original visualization);
![]() Share the visual;
Share the visual;
![]() Download;
Download;
![]() View in full screen.
View in full screen.
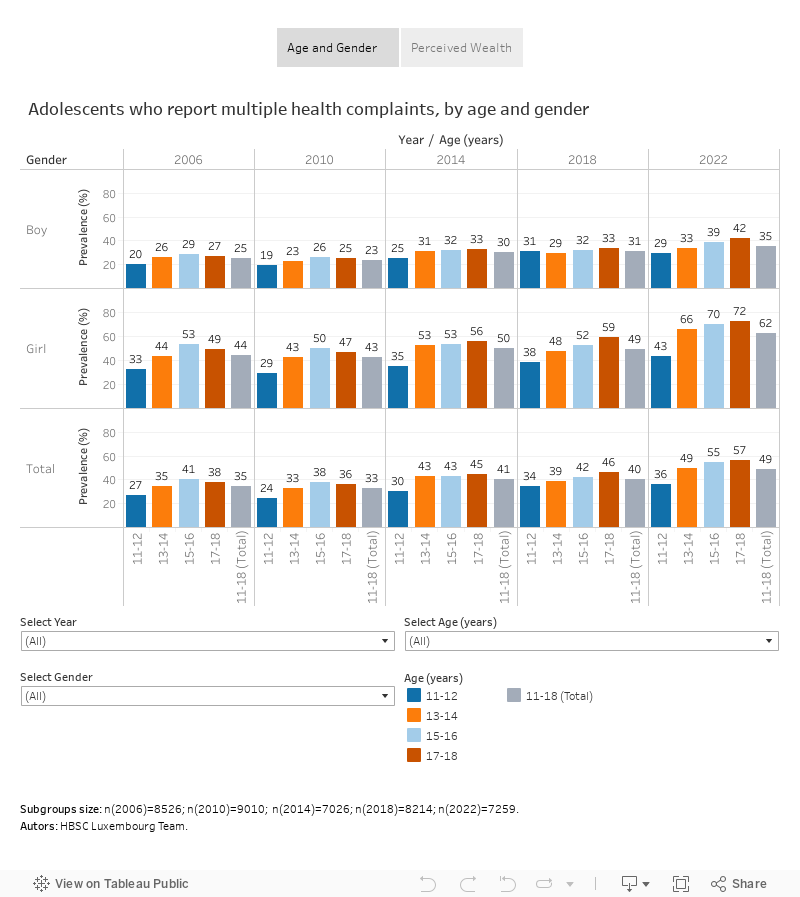
QUESTION
Adolescents were asked how often they experienced the following health complaints in the last 6 months: headache, stomachache, backache, feeling low, irritability or bad temper, feeling nervous, difficulties in getting to sleep and feeling dizzy. The answer categories ranged from “about every day” (category 1) to “rarely or never” (category 5). The findings in this visual present the proportion of adolescents who frequently have multiple health complaints, i.e at least two complaints occurring several times a week or even daily (categories 1 and 2).
FINDINGS
The findings below represents pupils from Luxembourg only. If you want to see Luxembourg in an international comparison: HBSC study data browser and International Report from the 2021/2022 survey.
How to navigate the data?
Check and/or uncheck the items from the list to filter or highlight;
Place the cursor on the chart to view the pop-up with more information;
Click the chart to highlight data.
In the bottom of the data vizualization ![]() click the bar icons to:
click the bar icons to:
![]() Reset (return to the original visualization);
Reset (return to the original visualization);
![]() Share the visual;
Share the visual;
![]() Download;
Download;
![]() View in full screen.
View in full screen.
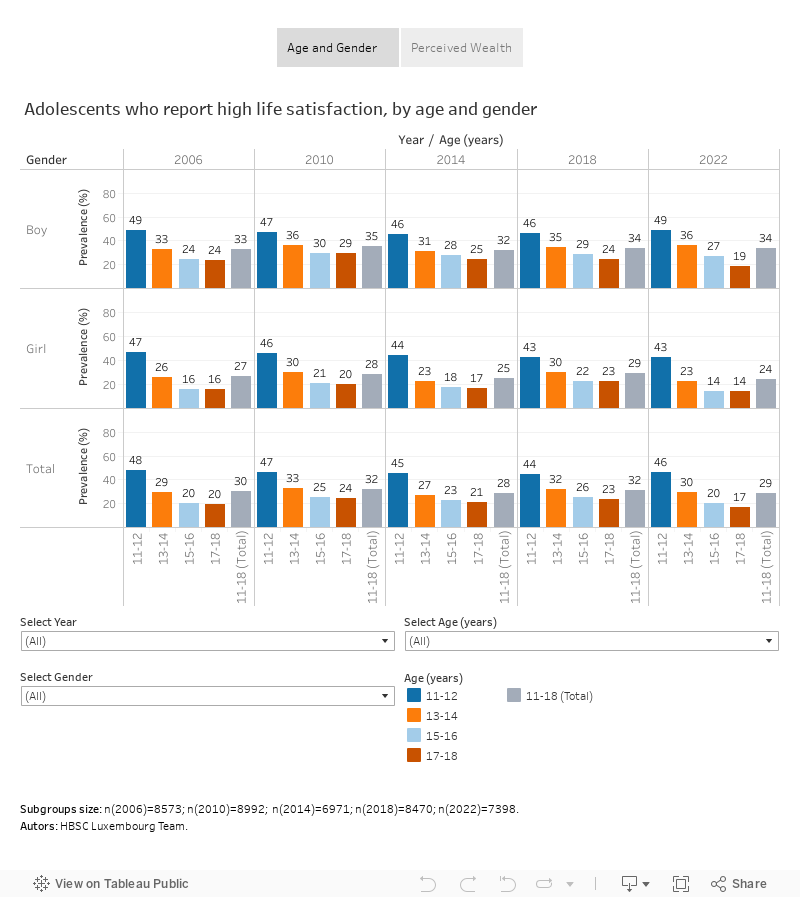
QUESTION
Adolescents were asked to rate their life satisfaction on a Cantril Ladder (Cantril, 1965), ranging from “10-best possible life” to “0-worst possible life”. The findings in this visual present the proportion of adolescents with a high level of life satisfaction (scores 9 and 10).
FINDINGS
The findings below represents pupils from Luxembourg only. If you want to see Luxembourg in an international comparison: HBSC study data browser and International Report from the 2021/2022 survey.
References:
Cantril, H. (1965): The pattern of human concerns. New Brunswick N.J.: Rutgers University Press.
How to navigate the data?
Check and/or uncheck the items from the list to filter or highlight;
Place the cursor on the chart to view the pop-up with more information;
Click the chart to highlight data.
In the bottom of the data vizualization ![]() click the bar icons to:
click the bar icons to:
![]() Reset (return to the original visualization);
Reset (return to the original visualization);
![]() Share the visual;
Share the visual;
![]() Download;
Download;
![]() View in full screen.
View in full screen.
Key indicators
Click on the indicator to explore the trends.
⇒ How to cite: Health Behaviour in School-aged Children Luxembourg Study (2023). Data visualization of the findings from Luxembourg HBSC surveys. https://hbsc.uni.lu/en/dashboard/