
Die interaktive Datenvisualisierung basierte ursprünglich auf dem Bericht „Trends from 2006-2018 in Health Behaviour, Health Outcomes and Social Context of Adolescents in Luxembourg“.
Die aktuelle Version der interaktiven Datenvisualisierung enthält nun auch die Daten der Erhebung von 2022. Sie zeigt die Entwicklung von Schlüsselindikatoren für für den sozialen Kontext von Kindern und Jugendlichen in Luxemburg zwischen 2006 und 2022.
Darüber hinaus wurden vier Factsheets veröffentlicht, die sich mit den Daten der Erhebung von 2022 befassen:
– Gesundheitsbeschwerden bei Kindern und Jugendlichen im Schulalter (Faktenblatt Nr. 1) ![]()
![]()
![]()
– Körperliche Aktivität, Ernährung und Gewichtsstatus bei Kindern und Jugendlichen im Schulalter (Faktenblatt Nr. 2) ![]()
![]()
![]()
– Substanzkonsum bei Kindern und Jugendlichen im Schulalter (Faktenblatt Nr. 3) ![]()
![]()
![]()
– Freude am Schulbesuch und wahrgenommener Stress durch Schularbeit bei Kindern und Jugendlichen im Schulalter (Faktenblatt Nr. 4) ![]()
![]()
![]()
Damit eine möglichst große Anzahl von Menschen barrierefrei auf die Datenvisualisierung zugreifen kann, wurde die Farbauswahl so gestaltet, dass Menschen mit Farbenfehlsichtigkeiten nicht beeinträchtigt werden.
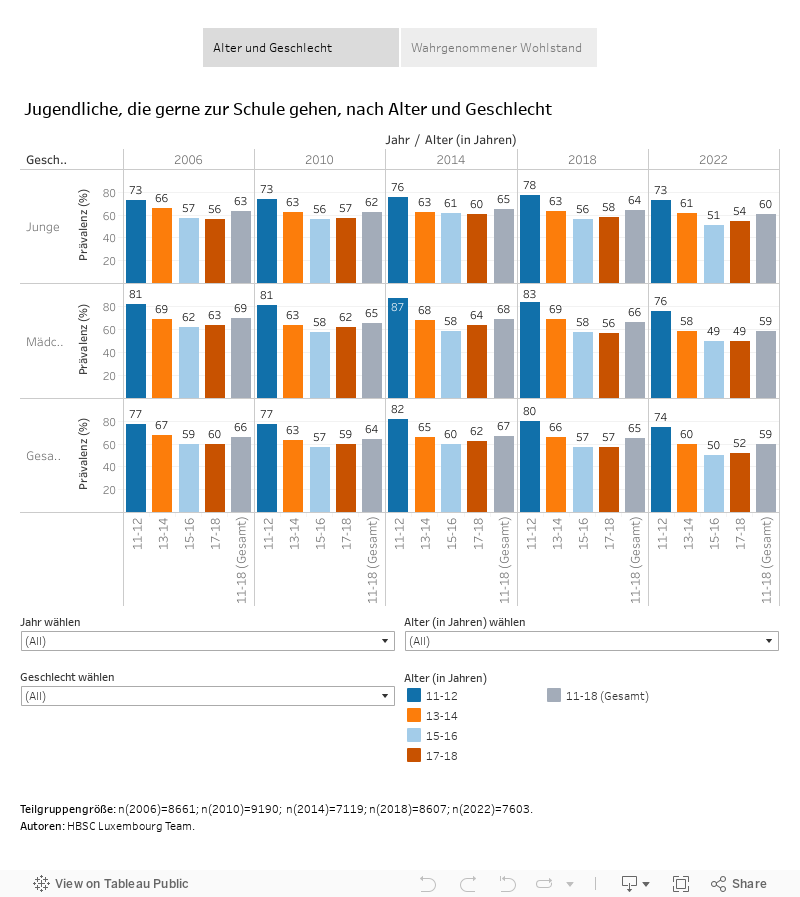
FRAGE
Die Jugendlichen wurden gefragt, wie sie momentan über die Schule denken (4-Punkte-Skala). Die Antwortmöglichkeiten reichten von 1 „Die Schule gefällt mir sehr gut“ bis 4 „Die Schule gefällt mir gar nicht.“ Die Ergebnisse in dieser Darstellung zeigen den Anteil der Jugendlichen, denen die Schule sehr gut gefällt oder denen die Schule ein wenig gefällt, d. h. Antwortmöglichkeiten 1 und 2.
ERGEBNISSE
Die folgenden Ergebnisse berücksichtigen ausschließlich Jugendliche aus Luxemburg. Hier finden Sie Daten über Luxemburg im internationalen Vergleich: European Health Information Gateway.
Wie navigiere ich durch die Daten?
Die Elemente in der Liste lassen sich aktivieren oder deaktivieren, um bestimmte Daten zu filtern oder hervorzuheben;
Wenn der Cursor auf die Tabelle geführt wird, erscheint ein Popup mit weiteren Informationen;
Zum Hervorheben von Daten bitte die entsprechende Tabelle anklicken.
Folgende Funktionen lassen sich über die Leistensymbole im unteren Teil der Datenvisualisierung aufrufen:![]()
![]() Zurücksetzen (zur ursprünglichen Darstellung zurückkehren);
Zurücksetzen (zur ursprünglichen Darstellung zurückkehren); ![]() Grafik teilen;
Grafik teilen; ![]() Herunterladen;
Herunterladen; ![]() Im Vollbildmodus anzeigen.
Im Vollbildmodus anzeigen.
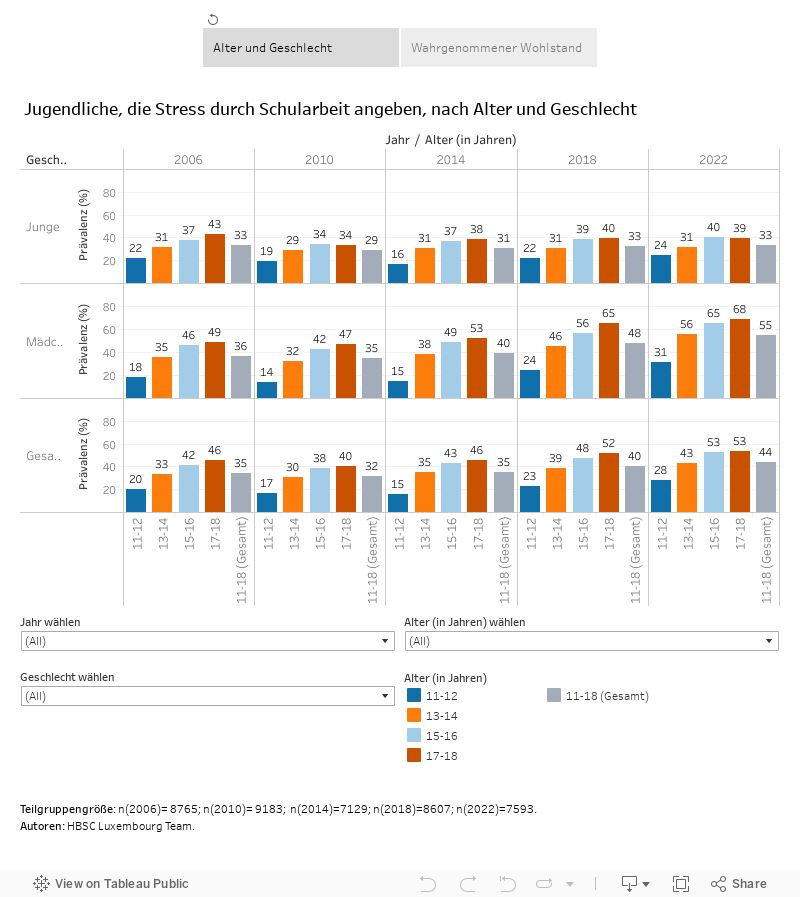
FRAGE
Die Jugendlichen wurden gefragt, wie sehr sie sich durch die Schularbeit gestresst fühlen. Die Antwortmöglichkeiten reichten auf einer 4-Punkte-Skala von 1 „Überhaupt nicht“ bis 4 „Sehr stark“. Die Ergebnisse in dieser Darstellung zeigen den Anteil der Jugendlichen, die in der Schule einen sehr hohen Leistungsdruck verspüren, d. h. Antwortmöglichkeiten 3 und 4.
ERGEBNISSE
Die folgenden Ergebnisse berücksichtigen ausschließlich Jugendliche aus Luxemburg. Hier finden Sie Daten über Luxemburg im internationalen Vergleich: European Health Information Gateway.
Wie navigiere ich durch die Daten?
Die Elemente in der Liste lassen sich aktivieren oder deaktivieren, um bestimmte Daten zu filtern oder hervorzuheben;
Wenn der Cursor auf die Tabelle geführt wird, erscheint ein Popup mit weiteren Informationen;
Zum Hervorheben von Daten bitte die entsprechende Tabelle anklicken.
Folgende Funktionen lassen sich über die Leistensymbole im unteren Teil der Datenvisualisierung aufrufen:![]()
![]() Zurücksetzen (zur ursprünglichen Darstellung zurückkehren);
Zurücksetzen (zur ursprünglichen Darstellung zurückkehren);
![]() Grafik teilen;
Grafik teilen;
![]() Herunterladen;
Herunterladen;
![]() Im Vollbildmodus anzeigen.
Im Vollbildmodus anzeigen.
FRAGE
Den Jugendlichen wurden drei Fragen über die Unterstützung durch Mitschüler*innen auf einer fünfstufigen Likert-Skala gestellt (Verbringen die Schüler*innen in der Klasse gerne Zeit miteinander? Sind sie freundlich und hilfsbereit? Werden die Jugendlichen so akzeptiert, wie sie sind?). Die Antworten auf diese Fragen wurden in eine Skala zusammengefasst, welche den Grad der Unterstützung durch Klassenkamerad*innen zeigt. Genauer gesagt wurde der Mittelwert aus diesen drei Fragen berechnet; die Ergebnisse in dieser Darstellung zeigen den Anteil der Jugendlichen, die eine hohe Unterstützung durch Mitschüler*innen angeben (d.h. ein Mittelwert von 4 oder besser).
ERGEBNISSE
Die folgenden Ergebnisse berücksichtigen ausschließlich Jugendliche aus Luxemburg. Hier finden Sie Daten über Luxemburg im internationalen Vergleich: European Health Information Gateway.

Wie navigiere ich durch die Daten?
Die Elemente in der Liste lassen sich aktivieren oder deaktivieren, um bestimmte Daten zu filtern oder hervorzuheben;
Wenn der Cursor auf die Tabelle geführt wird, erscheint ein Popup mit weiteren Informationen;
Zum Hervorheben von Daten bitte die entsprechende Tabelle anklicken.
Folgende Funktionen lassen sich über die Leistensymbole im unteren Teil der Datenvisualisierung aufrufen:![]()
![]() Zurücksetzen (zur ursprünglichen Darstellung zurückkehren);
Zurücksetzen (zur ursprünglichen Darstellung zurückkehren);
![]() Grafik teilen;
Grafik teilen;
![]() Herunterladen;
Herunterladen;
![]() Im Vollbildmodus anzeigen.
Im Vollbildmodus anzeigen.
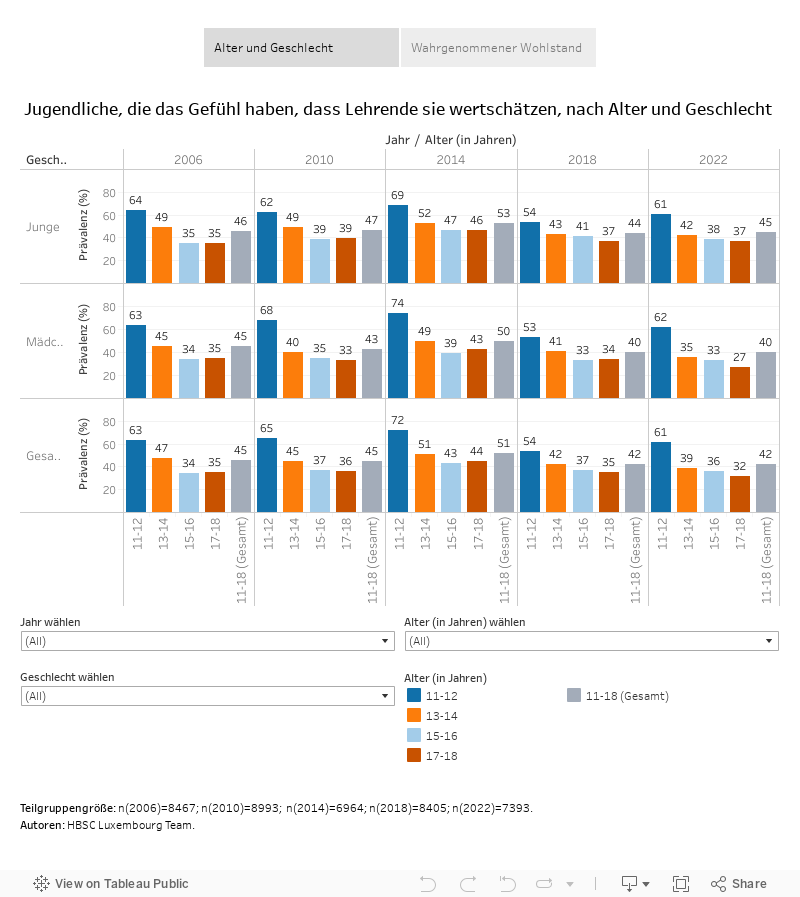
FRAGE
In allen HBSC-Umfragen wurden mehrere Fragen zum Verhältnis zwischen Lehrpersonen und Lernenden gestellt. Diese Fragen wurden jedoch bis auf eine Ausnahme zwischenzeitlich abgeändert. Die folgenden Werte basieren auf der Frage, ob die Jugendlichen der Meinung sind, dass ihre Lehrer*innen sie als Person wertschätzen (5-Punkte-Likert-Skala). Die Antwortmöglichkeiten reichten von 1 „Ich stimme voll und ganz zu“ bis 5 „Ich stimme überhaupt nicht zu“. Die Ergebnisse in dieser Darstellung zeigen den Anteil der Jugendlichen, die der Aussage zustimmen, dass Lehrkräfte sie als Person wertschätzen, d. h. Antwortmöglichkeiten 1 und 2.
ERGEBNISSE
Die folgenden Ergebnisse berücksichtigen ausschließlich Jugendliche aus Luxemburg. Hier finden Sie Daten über Luxemburg im internationalen Vergleich: European Health Information Gateway.
Wie navigiere ich durch die Daten?
Die Elemente in der Liste lassen sich aktivieren oder deaktivieren, um bestimmte Daten zu filtern oder hervorzuheben;
Wenn der Cursor auf die Tabelle geführt wird, erscheint ein Popup mit weiteren Informationen;
Zum Hervorheben von Daten bitte die entsprechende Tabelle anklicken.
Folgende Funktionen lassen sich über die Leistensymbole im unteren Teil der Datenvisualisierung aufrufen:![]()
![]() Zurücksetzen (zur ursprünglichen Darstellung zurückkehren);
Zurücksetzen (zur ursprünglichen Darstellung zurückkehren);
![]() Grafik teilen;
Grafik teilen;
![]() Herunterladen;
Herunterladen;
![]() Im Vollbildmodus anzeigen.
Im Vollbildmodus anzeigen.
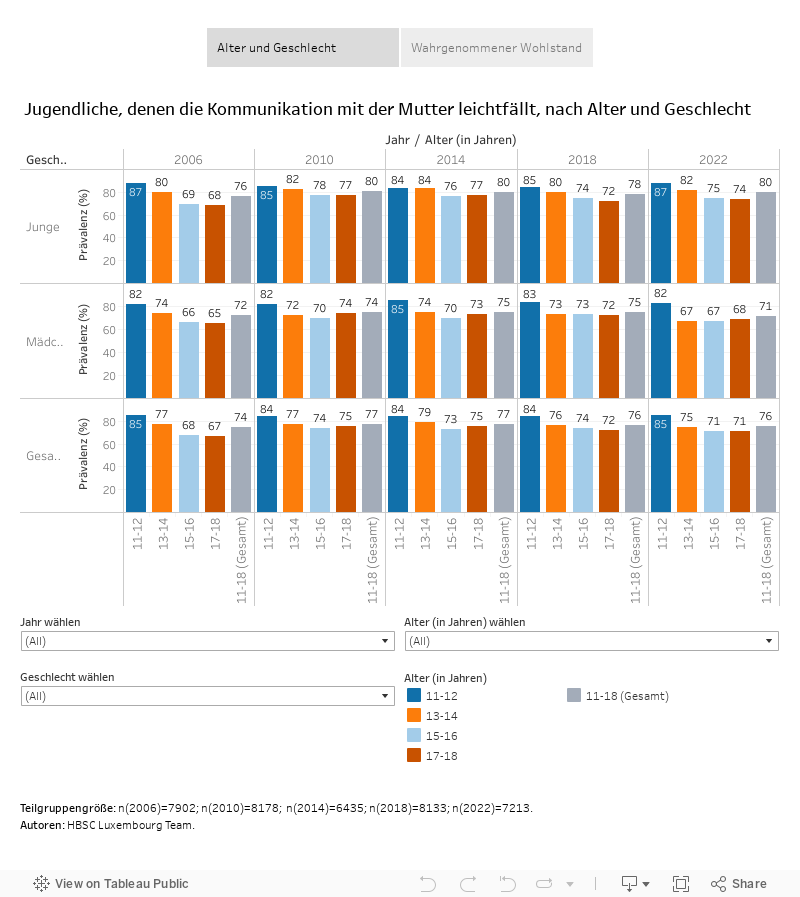
FRAGE
Die Jugendlichen wurden gefragt, wie leicht es ihnen fällt, mit ihrer Mutter über Dinge zu sprechen, „die dir große Sorgen machen.“ (5-Punkte-Skala) Die Antwortmöglichkeiten reichten von 1 „Fällt mir sehr leicht“ bis 5 „Fällt mir sehr schwer“. Die Antwort „Diese Person ist nicht mehr da oder ich habe keinen Kontakt mit ihr“ wurde ausgenommen. Die Ergebnisse in dieser Darstellung zeigen den Anteil der Jugendlichen, denen die Kommunikation mit ihrer Mutter leichtfällt (d. h. Antwortmöglichkeiten 1 und 2).
ERGEBNISSE
Die folgenden Ergebnisse berücksichtigen ausschließlich Jugendliche aus Luxemburg. Hier finden Sie Daten über Luxemburg im internationalen Vergleich: European Health Information Gateway.
Wie navigiere ich durch die Daten?
Die Elemente in der Liste lassen sich aktivieren oder deaktivieren, um bestimmte Daten zu filtern oder hervorzuheben;
Wenn der Cursor auf die Tabelle geführt wird, erscheint ein Popup mit weiteren Informationen;
Zum Hervorheben von Daten bitte die entsprechende Tabelle anklicken.
Folgende Funktionen lassen sich über die Leistensymbole im unteren Teil der Datenvisualisierung aufrufen:![]()
![]() Zurücksetzen (zur ursprünglichen Darstellung zurückkehren);
Zurücksetzen (zur ursprünglichen Darstellung zurückkehren);
![]() Grafik teilen;
Grafik teilen;
![]() Herunterladen;
Herunterladen;
![]() Im Vollbildmodus anzeigen.
Im Vollbildmodus anzeigen.
FRAGE
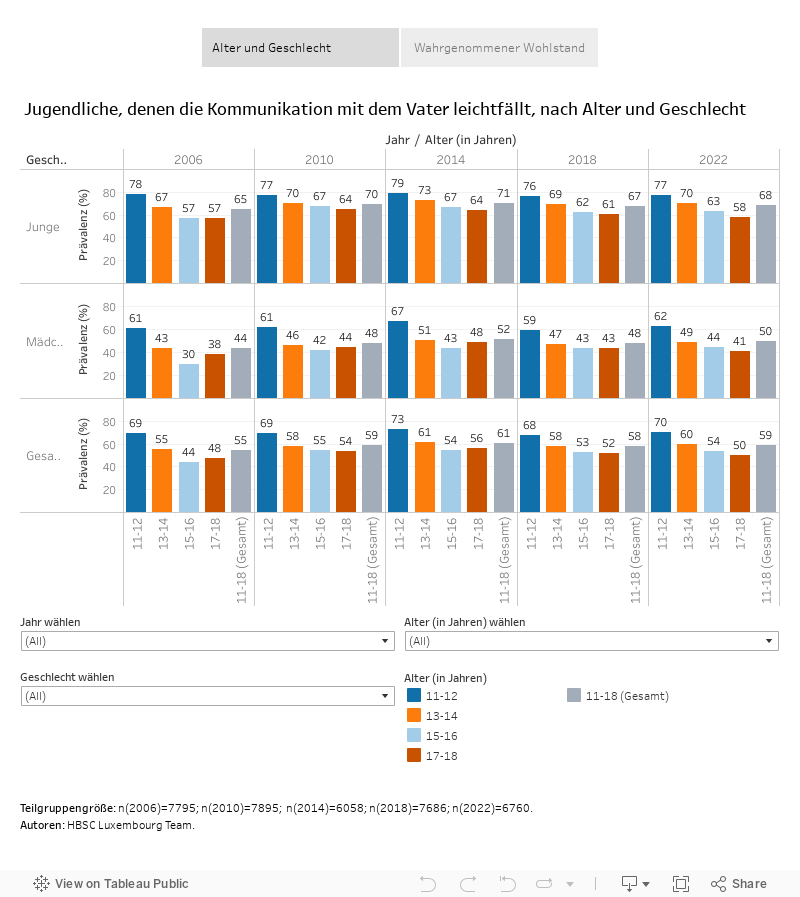
Die Jugendlichen wurden gefragt, wie leicht es ihnen fällt, mit ihrem Vater über Dinge zu sprechen, „die dir große Sorgen machen.“ (5-Punkte-Skala) Die Antwortmöglichkeiten reichten von 1 „Fällt mir sehr leicht“ bis 5 „Fällt mir sehr schwer“. Die Antwort „Diese Person ist nicht mehr da oder ich habe keinen Kontakt mit ihr“ wurde ausgenommen. Die Ergebnisse in dieser Darstellung zeigen den Anteil der Jugendlichen, denen die Kommunikation mit ihrem Vater leicht fällt (d. h. Antwortmöglichkeiten 1 und 2).
ERGEBNISSE
Die folgenden Ergebnisse berücksichtigen ausschließlich Jugendliche aus Luxemburg. Hier finden Sie Daten über Luxemburg im internationalen Vergleich: European Health Information Gateway.
Wie navigiere ich durch die Daten?
Die Elemente in der Liste lassen sich aktivieren oder deaktivieren, um bestimmte Daten zu filtern oder hervorzuheben;
Wenn der Cursor auf die Tabelle geführt wird, erscheint ein Popup mit weiteren Informationen;
Zum Hervorheben von Daten bitte die entsprechende Tabelle anklicken.
Folgende Funktionen lassen sich über die Leistensymbole im unteren Teil der Datenvisualisierung aufrufen:![]()
![]() Zurücksetzen (zur ursprünglichen Darstellung zurückkehren);
Zurücksetzen (zur ursprünglichen Darstellung zurückkehren);
![]() Grafik teilen;
Grafik teilen;
![]() Herunterladen;
Herunterladen;
![]() Im Vollbildmodus anzeigen.
Im Vollbildmodus anzeigen.
Schlüsselindikatoren
Zum Betrachten der Trends den Indikator anklicken.
⇒ Wie man zitiert: Health Behaviour in School-aged Children Luxembourg Study (2023). Data visualization of the findings from Luxembourg HBSC surveys. https://hbsc.uni.lu/de/de-dashboard/